Laser Scanning Demonstration of Highway 7 / E18 in Finland
By Nina Heiska
March 2021


Introduction
Nordic Geo Center Oy, RIEGL’s distribution partner in Sweden, Finland and Estonia recently performed a demonstration project with the RIEGL VMX-2HA on Highway 7 (aka E18); a highway that traverses east-west from Helsinki to Vaalimaa, on the Finnish side of its border with Russia.
Nordic’s Nina Heiska and Hannu Heinonen wanted to show how the RIEGL mobile laser scanning (MLS) system – with both lasers configured to operate at full capacity, and paired with its six cameras – easily collects massive amounts of high quality 3D data at highway speeds over a four hour round-trip journey.

Join me and my colleague Hannu Heinonen on a VMX-2HA surveying tour in the southeastern portion of my home country of Finland.
Hannu and I wanted to demonstrate the capabilities of the RIEGL mobile scanner and software when operating with every feature at full capacity over a fairly long, continuous route. We wanted to show how the system successfully handles large amounts of data. We also wanted to highlight examples of additional applications for the point clouds that will increase the value of the 3D files. Upon completing this exercise we created a demonstration file for our clients in Sweden, Finland and Estonia. Nordic Geo Center Oy supports many private companies who are tasked with designing and constructing new and repaired roadways, as well as public roadway officials who rely on 3D data for their work.
During our 4-hour journey the VMX-2HA system, including the six cameras, was configured to automatically collect at a data acquisition rate of 710 – 735 GB/100 km depending on the speed. If we were collecting laser data only, the acquisition rate would have been 136 GB/100 km at the speed of 120 km/h. It would have been 152 GB/100 km at 100 km/h. If cameras are required, the amount of data grows large and collections are limited to daylight hours only.
The Highway 7 route we mapped is located roughly between E25.06 N60.25 and E27.8 N60.6, an area that travels from Helsinki eastward to the Finland/Russia border. Highway 7 is part of E18, which was called King’s Road during medieval times and remains a main coastal route today. The current E18 is a highway that runs from all the way from Ireland to Russia.
Let’s start the tour with a brief video recorded from inside the vehicle.
The 180 km survey route on Highway 7 extends from the western portion of Helsinki, Finland eastward towards the Russian border.

Click for Video of the Finland Highway 7 Route During the Scanning Demonstration

In this 50 second video you will see the typical conditions of Highway 7, located in southeastern Finland. The data was captured on a sunny day in early December 2020, before the snow. The team scanned one time in each direction without any additional traffic control. The data they collected could be used to assess asphalt conditions, perform a roadway inventory, and other applications touched on in this article.
Important Notes
• The survey initiated in Helsinki at the crossing of Ring 1 (Kehä I) Espoo and Highway 7.
• We followed the speed limits, 120 km/h, from Helsinki eastward to the City of Vaalimaa, Finland.
• During the return journey our average speed was 100 km/h.
• The distance each direction is 180 km and the whole project, round trip, took four hours to complete.
A FEW KEY OBSERVATIONS
Needed improvements to traffic markings are easily found and mapped.

One thing that we paid particular attention to during our journey were the painted traffic lines. On some roads they are not as straight as they should be. With autonomous vehicles relying on the highway markings for positioning, it is essential that the markings strictly match the geometric design.
The LiDAR images clearly show some areas that could be improved. A contractor can use the scanned data to compare the lane markings with the actual design and guidelines. Where the lines are outside of compliance, painters can be directed to repaint them. The crews can be shown where the trouble-spots are located to within one to two centimeters.
These LiDAR datasets are perfect for the creation of HD maps for autonomous vehicles.
The data we were able to obtain in only four hours with the VMX-2HA is precise and accurate enough for all manner of road design, construction and maintenance. But this same scanning equipment is ideal for the creation and updating of high definition (HD) maps for autonomous vehicles (AV). Interestingly, AV HD maps require a bit less accuracy than datasets for design and construction.
The RIEGL mobile scanners have already been used with great success for creation of these types of HD maps in the US, China and Sweden. The need for these types of maps will only grow.

Point clouds can be visualized in several ways to understand the data better.
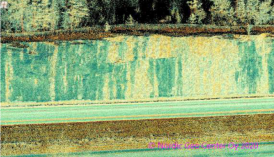
The roadway shown in reflectance view reveals that the surface of the road was still slightly moist (greenish blue color), but the lane shown in yellow had already dried more compared to the rest of the surface. Its asphalt surface is also probably more worn due to heavier traffic on it.
The painted lines reflect light differently on each side of the road. The difference might be due to moisture, but it could also indicate various ages of the material.
When the road is measured in stable conditions it is possible to calculate if the painted areas and traffic signs reflect light as they should according to standards. Normal camera images cannot be used for such a purpose.
The third detail that jumps immediately to the eye on this image is the coloring of the rock surface. It is relatively even and indicates homogenous rock. As we see later, such rock faces often show various rock types crisscrossing the surface. Even though the VMX-2HA system used only one wavelength, it is possible to observe spectral differences in rock.
Early in the journey we arrived at Ahvenkoski, Finland. Here the Kymi River meets the Great Coastal Road, which made Ahvenkoski a lively trading center in the past. It was also a border station between Sweden and Russia during the 18th century, which means that the now quiet area has a lot of historic sights to see.

In our view from the main road we captured the newer bridge over Kymi River, the older 1960s-constructed bridge, and parts of the 1930s dam and power plant. A wider landscape containing also old manors, military fortifications and an earlier 1920s bridge is now protected as a structure of historical significance.
Inside the 500 meter long tunnels we achieved very good geo-positioning results using only the built-in IMU, even without the GNSS. We collected the data inside each of the tunnels at very high driving speed. As we processed the data everything fit together nicely with barely any adjustment on our part.

Documenting interchanges was easy.
Highway 7 has many interchanges that are relatively evenly spaced from start to finish. Most of them are asymmetric, but the image on the left shows a nice symmetrical intersection with four ramps and a bridge crossing the main road.
As there are many intersections, there are many bridges and underpasses as well.
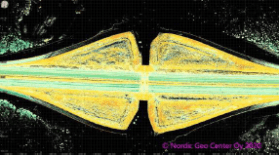
The images below show what one of the structures that is meant for wild animal crossing looks like when it is scanned only from the road below.
Cameras frequently record animals using these crossings. Moose and deer in Finland are, unfortunately, involved in many traffic accidents. As a precaution many of the main roads are fenced to keep them away from harm.


In addition to the normal roadway condition assessments and inventories, we encountered many peripheral applications for the information. The value of the point cloud increases exponentially when there are more ways to use the data.
PERIPHERAL APPLICATIONS
Power-line mapping helps roadway managers coordinate with utility companies.
Along our route, large and small power-lines cross the highway in several locations. We captured this image of a pylon at the very beginning of the route while still near Helsinki. Land-based LiDAR scanners can obtain a lot of detail about power-lines such as views that allow confirmation that each and every part of the structure is intact, or to see if there is encroaching vegetation, for example.
We typically think that only drones should be used for this type of overhead survey. This is not necessarily so. The data we obtained from the vehicle, traveling along at roadway speeds, was of survey quality.
The same is true about other features such as drainage design and structures, lighting and signage, nearby buildings, animal crossings, and retaining walls and fences. Pavement or concrete on a highway are just a small portion of the subject matter that can be collected and used by different individuals.
Important geological information can be viewed easily with LiDAR.
When we planned this LiDAR survey one of our aims was to capture the many large rock cuts lining the road. Earlier in this article we viewed one area made of homogenous rock. The images below show the variability of the different rock types and other interesting details that are available if you know what you are looking for.
A varve is a pair of thin layers of clay and texture that represent the deposit of a single year (summer and winter) in a lake. Such layers show the chronology of glacial sediments that can be predictive for how this area will shift over time naturally or during future construction.

For instance, geologists are always interested in seeing varves in the rock, as they have a story to tell to the experienced eyes. The first image shows such a varve as a clear horizontal line cutting the rock.
Points of cultural and historical interest can be seen in a 3-D “digital twin.”
Highway 7 has its own art program. In practice this means that different sorts of environmental art and details were constructed along the way, including a wooden bridge. However, the construction of the road has also inspired local residents who have also decorated the road with interesting folk art.
Often this type of unofficial constructions are taken away as they may be considered traffic hazards. But in some cases they pose no problems and have become very popular.

The most celebrated piece of folk art is a “forest of palm trees” erected near the historic town of Pyhtää. This folk art exhibit is now invisible from the road but you can see it on the LiDAR datasets. Real palm trees are not native in Finland of course. But that does not stop people from dreaming about them.
At this point we have arrived at the border between Finland and Russia. This major roadway continues to St. Petersburg, Russia, the seventh largest city in Europe. The Finland/Russia border includes a trade station, and we were curious to
measure the length of a building within its latest commercial center. With just a few clicks of the mouse we could see from the data that the length is almost 300 meters.

Now our survey was only half-finished. We still had the scanning to do on the return trip. So after a refreshing coffee break we returned to Helsinki, scanning for the next two hours without stopping. It was a beautiful day and the equipment worked perfectly. The data was soon uploaded to a computer in our office in Helsinki, and the files were managed just as we had expected and without any surprises.
In summary, so much can be achieved with a single LiDAR data set. The traditional applications for roadway design, construction and maintenance are just the beginning.
Please contact me if you are interested in seeing the data. My contact information is at the end of this article.
Thank you for joining Hannu and me on this brief LiDAR tour of Finland’s Highway 7.
– Nina
About the RIEGL VMX-2HA

The RIEGL VMX-2HA is a high speed, high performance dual scanner mobile mapping system which provides dense, accurate, and feature-rich data at highway speeds. With two million measurements and 500 scan lines per second, this turnkey solution is ideally suited for survey-grade mobile mapping applications.
This powerful technology comprises two RIEGL VUX-1HA high accuracy LiDAR sensors and a high performance INS/GNSS unit that is housed in an aerodynamic and protective cover. Optional camera systems complement LiDAR data with precisely geo-referenced images. The combination of up to nine different cameras (including the panorama camera FLIR Ladybug 5+ and 5MP/9MP/12MP RIEGL cameras with minimal lens distortion) allows perfect adaptation of the camera configuration to the respective task. Seamless workflow for MLS data acquisition, processing and adjustment is provided by RIEGL’s proven software suite.
About Nordic Geo Center Ltd.

Nordic Geo Center Ltd. is a RIEGL distributor serving Finland, Estonia and Sweden. The company also trains its customers to use their sensors to achieve good results.

Hannu Heinonen, the founder of the company, has worked with surveying instruments since 1970s. Hannu studied in Finland and received additional training in geodesy, optoelectronics and photogrammetry in Heerbrugg, Switzerland. One of his earlier companies developed total station software for surveying applications. Mr. Heinonen has also participated in the development of the world’s first freely programmable total station (based on Hannu’s idea) with Nikon Corporation in Japan and consequently with a similar instrument with Zeiss in Germany. In the early days of static laser scanners, Hannu contributed to the development of certain RealWorks Survey algorithms for Mensi in France.
Since 2014, Nordic Geo Center Oy has tested and developed the use of RIEGL VMX mobile laser scanning in road measurements together with RIEGL Laser Measurement Systems, Austria.
Nina Heiska, author of this article, is the product manager at Nordic Geo Center Oy. Nina has a master’s Geo Center Ltd. with the RIEGL VMX-2HA. degree in archeology from the University of Helsinki, and bachelor’s degree in Laser Scanning from Evtek University of Applied Sciences. She has worked and studied in several countries including Italy, Jordan, Austria and UK.
Nina has worked for the past six years under the guidance of M.Sc. (Eng) Tauno Suominen, who has a quarter-century of experience with airborne and mobile laser scanning including the development of helicopter-based scanning and software for road infrastructure projects in the late 1990s.
Currently Nina is in the steering group of VTT coordinated 3D LIDAR ecosystem project which develops LiDAR – both components from light sources and electronics to micro-mirrors and a MEMS scanner in Finland. VTT’s LiDAR’s application is for use in autonomous vehicles, and also machine control systems that will be equipped with scanners in the future.
#END#
To view this article in PDF format, click the link below.
To the Russian Border and Back
Note: This article was published it’s original form and in Finnish language on the
Nordic Geo Center Oy web blog. http://www.geocenter.fi/blogi/vaalimaalle-ja-takaisin-skannaten-tietysti/

About RIEGL:
RIEGL is an international leading provider of cutting-edge technology in airborne, mobile, terrestrial, industrial and unmanned laser scanning solutions.
RIEGL has been producing LiDAR systems commercially and focuses on pulsed time-of-flight laser radar technology in multiple wavelengths.
RIEGL’s core technology, the digitization of LiDAR signals (“Waveform LiDAR”), provides unique methodologies for resolving range ambiguities, multiple targets per laser shots, optimum distribution of measurements, calibrated amplitudes and reflectance estimates, as well as the seamless integration and calibration of systems.
RIEGL’s Ultimate LiDARTM 3D scanners offer a wide array of performance characteristics and serve as a platform for continuing Innovation in 3D for the LiDAR industry.
From the first inquiry, to purchase and integration of the system, as well as training and support, RIEGL maintains an outstanding history of reliability and support to their customers.
Worldwide sales, training, support and services are delivered from RIEGL’s headquarters in Austria; main offices in the USA, Japan, China, Australia and Canada; and a worldwide network of representatives.